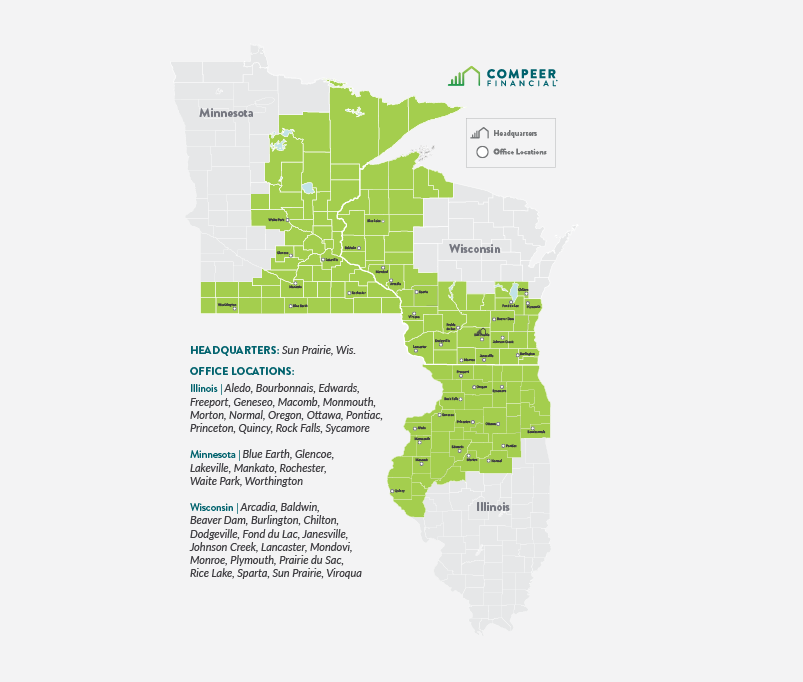
Compeer Financial Territory Farmland Value Trends
Compeer Financial Territory Farmland Value Trends
Some of you have probably wondered how the value of agricultural real estate has fared during the pandemic. Individually you know what’s going on in your local markets and what some of the surveys are indicating. I want to take this opportunity to share our perspective across the Compeer footprint using current analyzed sales data.
Instead of conducting a survey, Compeer Financial appraisers complete annual appraisals on the 36 benchmark farms in Compeer territory on July 1. These farms consist of a full range of agricultural properties distributed throughout the association territory used to track historical land and capitalization rate data.
Demand for farmland continues to be moderate in most areas, while supply continues to be limited. Land values have fallen from the peak in 2013 for Illinois and Minnesota, and 2015 for Wisconsin following commodity price trends. While land values have fallen since they peaked, decreases have not been as severe, as a percentage, compared to declines in commodity prices.
Northern/Western Illinois
Illinois farmland is classified under a universally accepted soil survey system that breaks land down into quality classifications based on productivity indexes. While values and yields for each cropland type tend to vary by location, the relative productivity does not.
The following chart illustrates changes by cropland type for the northern and western Illinois benchmarks. Average values across A, B and C farm types were essentially static at -0.1%. The largest change in value for the update period was to the recreational/hunting benchmark at +8.6%.
| Northern/Western Benchmark Value Changes | ||||
| Type of Land | Range | Average Value | 1 year change | Range |
| 1 - A High Quality Farmland | $10,000 - 13,027 | $11,443 | 0.2% | -3.0% - +4.0% |
| 2 - B Good Quality Farmland | $7,000 – 10,588 | $9,464 | -2.2% | -4.2% - 0.0 |
| 3 – C Average Quality Farmland | $4,099 – 10,101 | $ 7,021 | 2.0% | 0.0% - 4.6% |
| Recreational | $3,801 | $3,801 | 8.6% | NA |
Northern Illinois benchmarks were down an average of 1.5%. Of the six benchmarks in this region, five A and B quality farms were in a range of -4.2% to 0.0%, while the C quality benchmark was up 1.8%. The highest valued benchmark in northern Illinois was as -3% after an -8.2% change in 2019. The two B quality farms in northern Illinois were at -2.8% and -4.2%.
Western Illinois benchmarks were up an average of 0.8%. Of the ten agricultural benchmarks in the region, five were up in a range of 1.0% - 4.6% and three were down in a range of -3.8% to - 0.3% with two unchanged. The three cropland A benchmarks for the region were in a range from unchanged to +4.0% with an average value of $12,733, while the three B quality farms were down in a range from -3.8% to -0.3%. There are four C quality farms and they were up in a range of 0.0 to 4.6%.
The following graph illustrates the 2010 – 2020 Illinois benchmark trends by land class:
.PNG)
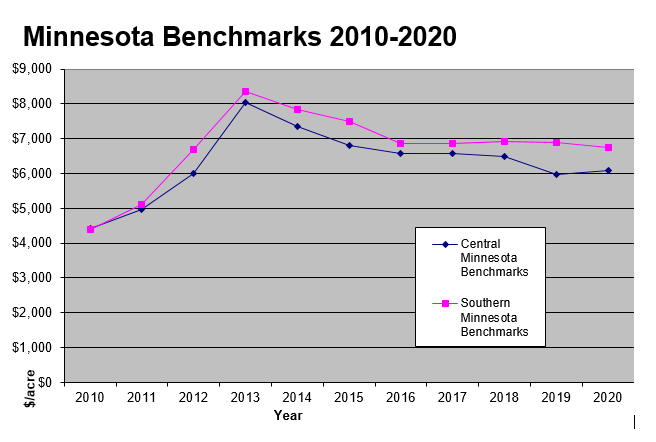
Central/Southern Minnesota
Minnesota is divided into two benchmark regions within the Compeer territory, with two benchmarks in the central region and eight in the southern region. Each benchmark is valued as improved and unimproved, with my focus on changes to land values, without considering the building improvements.
As a group, these benchmarks were -1.2% for the period with two benchmarks -5.0% or greater
The chart below illustrates the benchmarks changes by region.
| Central/Southern Minnesota Benchmark Value Changes – Bare land | ||||
| Type of Land | Range | Average Value | 1 year change | Range |
| Central Minnesota | $5,402 - 6,769 | $6,086 | 1.7% | 0.0% - 3.9% |
| Southern Minnesota | $4,000 – 7,900 | $6,749 | -2.2% | -5.8% - +1.6 |
Five benchmarks lost value, three were unchanged while two increased in value. Eight of the benchmarks are located in southern Minnesota, and five lost value for the update, with three of them losing in excess of 5% each.
One central Minnesota benchmark was unchanged while the other was up 3.9% from the 2019 update, after being down in 2019. This area has more variability, and slightly lower quality farms than found in southern Minnesota.
The eight southern Minnesota benchmarks were at -2.0% after being essentially unchanged in 2019. Two were unchanged, two were up 0.7% to 1.6%, and five were down in a range of -5.8% to -0.7%. Land quality is better than central Minnesota in this area.
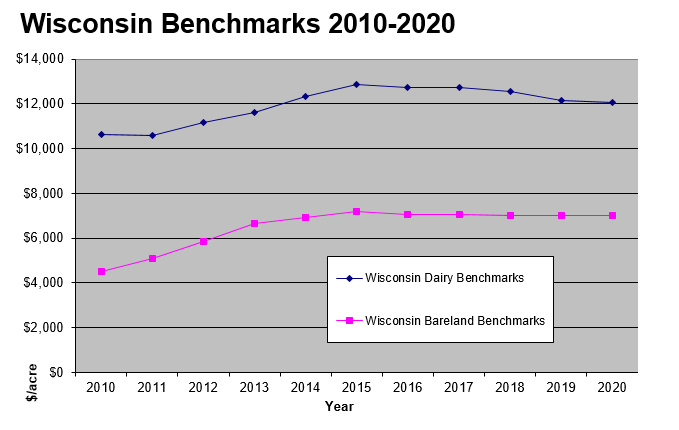
Wisconsin
Wisconsin land values are not driven as much by cash grain prices as Illinois and Minnesota and show slightly different trends. Benchmark values in Wisconsin peaked with the 2015 benchmark updates. Land values tend to be tied closer to milk prices, and the demand for support land for dairy farms. While the benchmarks are shown as dairy and bare land in the table below, they are not necessarily separate benchmarks. In Wisconsin we track values separately for five of the dairy/improved benchmarks. The higher per acre benchmark is a highly improved dairy farm with buildings making up the predominant value while the others are improved farms where land makes up the bulk of the value.
| Benchmark Value Changes | ||||
| Type of Land | Range | Average Value | 1 year change | Range |
| Dairy Benchmarks | $4,585 – 32,667 | $12,047 | 0.8% | -4.1% - +6.6% |
| Bare land Benchmarks | $3,886– 11,156 | $7,006 | 0.6% | -6.2% - +6.4% |
While the dairy benchmarks were +0.8% on average, the highly specialized dairy benchmark was -2.0% for the period. The non-specialized dairy farms have significant percentages of value in land meaning that changes in value are driven more by land values than improvement values. Two of the bare land benchmarks were down, three were unchanged and three increased in value.
While there have been weaknesses in the dairy industry as a whole, most of the significant decreases in value has come from dairy farm sales outside of Wisconsin. There are Wisconsin farms transitioning out of dairy with sales of some operating dairy farms converting to other uses. There continues to be a strong dairy infrastructure and support structure adding strength to the industry.
Summary
There continues to be significant economic stress in agriculture, but overall land values continue to be stable. The COVID19 crisis has added another level of uncertainty in agriculture and the economy in general. A significant amount of money has been pumped into the economy, including the agricultural sector. While milk prices have recovered significantly to above pre-pandemic levels, hog prices continue to lag and live cattle prices struggle significantly below their January and February levels. Corn and soybean prices continue to struggle with December 2020 corn futures around $3.25 BU and soybeans around $9.00 after a post COVID19 rally.
Since 2013, land values have been sustained more on accumulated earnings and future expectations than current earnings after being fueled by strong commodity prices leading up to 2013.
The pandemic of 2020 is a significant event with long term implications for agriculture. The timing of shutdowns hit around the time farmers were preparing for the planting season during a period where land sales traditionally slow down. There were some successful online real estate sales in March and April with some very strong prices. Activity for farmland has slowed, as it normally does while sales activity for recreational land continues to be brisk. Since the majority of farmland sales between harvest through the spring, I expect to see a clearer picture of the direction of the farmland real estate market this fall.
Receive the latest industry insights directly. SIGN UP FOR APPRAISAL NEWSLETTER