Farmland Markets in Compeer Territory
During the summer of 2020, commodity prices bottomed out. After beginning the year approaching a national average of $3.80/BU by August, corn prices (nationally) were just over $3.10/BU. The 2020 benchmark update indicated minimal changes from the 2019 update.
Early 2020 fall land sales activity indicated markets were stable to slightly stronger than we saw in the spring. From the low in August 2020, corn prices increased to almost $4.00/BU by year end, and during which time we began to see a very strong land market developing.
Moving into summer 2021, corn prices were approaching $6.00/BU for July and $5.25/BU for October delivery. Land values had a positive reaction to increasing commodity prices with land sales rivaling what we saw in 2012 in some locations, including multiple sales over $15,000/AC. Benchmarks are distributed throughout the Compeer Financial territory making it impossible to address micro markets; however, I will try and paint a general picture of farmland markets in the Compeer territory.
Demand for farmland is strong in most areas as evidenced by recent activity. The supply of land on the market continues to be limited, but higher prices are bringing more supply to the market. Input costs continue to escalate, but there are no indications they have any influence in current land markets.
As of the end of July, 68% of the Illinois corn crop is rated as good to excellent, compared to Minnesota at 38%, and Wisconsin at 75%. There are areas of dryer conditions including northern Illinois, southern Minnesota and central Wisconsin. In Illinois, 8% of the corn crop is rated poor to very poor, compared to Minnesota at 21%, and Wisconsin at 5%. Soybean conditions are rated similar to corn for all three states, while pasture conditions in Minnesota are rated at 66% and Wisconsin at 16%, poor to very poor.
Northern/Western Illinois
Illinois farmland is classified under a universally accepted soil survey system that classifies land based on soil productivity indexes developed by the University of Illinois. While values and yields for each cropland type may vary by location, the relative productivity does not.
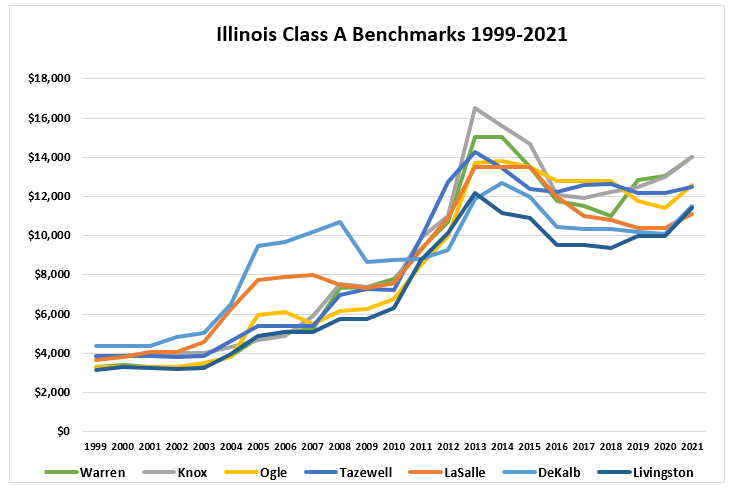
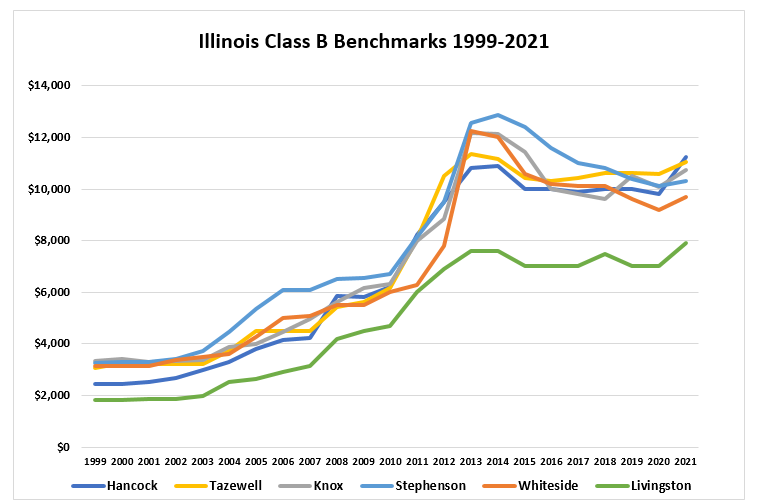
The following chart illustrates changes by cropland type for the northern and western Illinois benchmarks. Average values across A, B and C farm types increased an average of 8.3%. All 19 benchmarks in Compeer territory increased in value during the update period with eight of those increasing in excess of 10%.
Northern/Western Illinois Benchmark Value Changes | ||||
Type of Land | Range | Average Value | 1-year change | Range |
1 - A High Quality Farmland | $11,400 - 14,029 | $12,466 | 9.0% | 2.6 - 14.0% |
2 - B Good Quality Farmland | $7,900 – 11,250 | $10,153 | 7.6% | 2.0 - 14.8% |
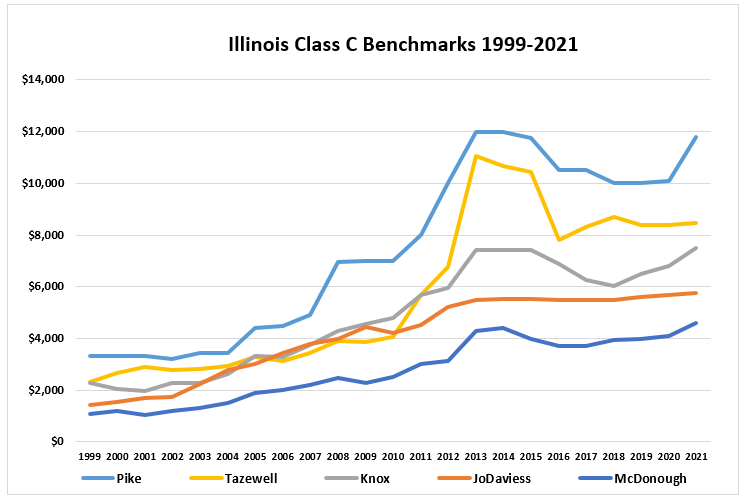
3 – C Average Quality Farmland | $4,601 – 11,798 | $ 7,623 | 8.2% | 0.7 - 16.8% |
Recreational | $4,096 | $4,096 | 7.8% | NA |
Northern Illinois benchmarks were up an average of 6.6% for the period. Of the six benchmarks in this region, five A and B quality farms were up in a range of 2.2 to 13.9%, while the C quality benchmark was up marginally at 0.8%. The highest valued benchmark in northern Illinois was up 10.6% after an -8.2% change in 2019 and -3.0% change in 2020.
Western Illinois benchmarks were up an average of 8.3%. Of the ten agricultural benchmarks in the region, four were up in a range of 10.3% - 16.8% and the remaining six were up in a range of 0.7% to - 7.7%. The three cropland A benchmarks for the region were in a range from up 2.6-7.7% with an average value of $13,504 while the three B quality farms were up in a range from 4.2% to 14.8%. There are four C quality farms that were up in a range of 10.3 to 16.8%.
The following graph illustrates the 2010 – 2021 Illinois benchmark trends by land class:
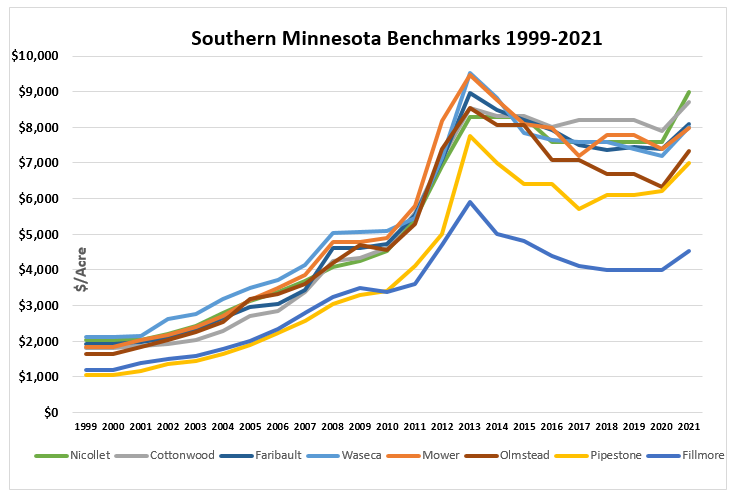
Central/Southern Minnesota
There are two benchmark regions within the Compeer territory in Minnesota, two benchmarks in the central region and eight in the southern region. Each benchmark is valued as improved and unimproved with my focus on changes to land values, without considering the building improvements.
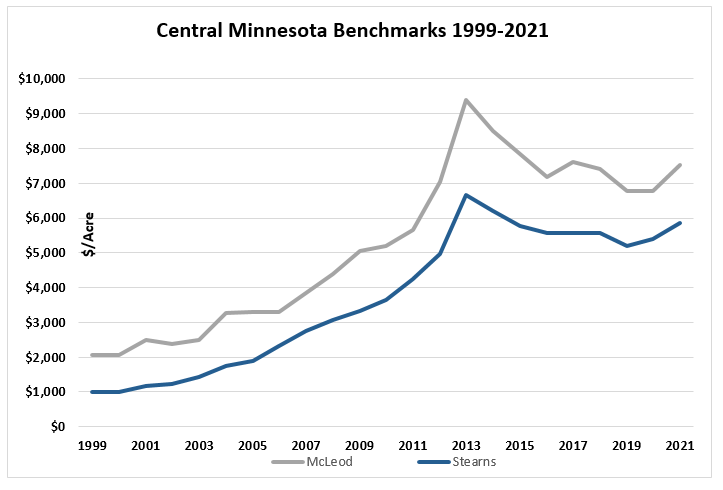
As a group, the central and southern Minnesota benchmarks were up 11.9% for the period. Seven benchmarks showed strong increases in value from 10.1-18.6%, while the remaining three increased in value 7.8-9.5%. Demand in both areas is consistent with trends in other areas with strong commodity prices fueling stronger demand.
The chart below illustrates the benchmarks changes by region.
Central/Southern Minnesota Benchmark Value Changes – Bare land | ||||
Benchmark Location | Range | Average Value | 1-year change | Range |
Central Minnesota | $5,849 - 7,638 | $6,694 | 9.8% | 8.3 - 11.4% |
Southern Minnesota | $4,529 – 9,000 | $7,578 | 12.4% | 7.8 - 18.6% |
The central Minnesota benchmarks were up 8.3% and 11.4% respectively from the 2020 update, after being down in 2020 from the 2019 update. This area has more variability and slightly lower quality farms than found in southern Minnesota.
Six of the eight of the benchmarks in southern Minnesota had increases exceeding 10.0%, while the remaining two had an increase of 7.8-9.5%. These benchmarks were down 2.2% in the previous update. Land quality is better than central Minnesota in this area.
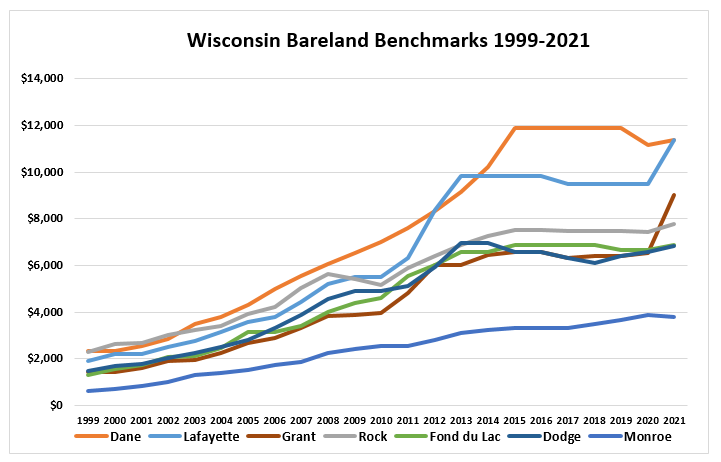
Wisconsin
Wisconsin land values are not influenced to the same degree by cash grain prices as Illinois and Minnesota. Trends are somewhat different with benchmark values peaking in Wisconsin with the 2015 benchmark updates. Land values are aligned closer to milk prices, and the demand for support land for dairy farms. While the benchmarks are shown as dairy and bare land in the table below, they are not necessarily separate benchmarks. In Wisconsin, values are tracked separately for five of the dairy/improved benchmarks. The higher per acre benchmark is a highly improved dairy farm with buildings making up the predominant value, while the others are improved farms where land makes up the bulk of the value.
Benchmark Value Changes | ||||
Type of Land | Range | Average Value | 1-year change | Range |
Dairy Benchmarks | $4,689 – 34,667 | $12,242 | 9.3% | 1.0% - 38.5% |
Bare land Benchmarks | $3,782– 11,392 | $7,737 | 10.2% | -2.7% - 38.3% |
While the dairy benchmarks were up 9.3% on average, the highly specialized dairy benchmark was up 6.1% for the period. The non-specialized dairy farms have significant percentages of value in land meaning that changes in value are driven more by land values than improvement values. With the exception of the Grant County benchmark, all the other benchmarks were in a range of 1.0-9.1%. Eliminating that benchmark, average values of the remaining benchmarks were up 4.4%. The Grant benchmark was up significantly due to an extremely hot market and was likely due for a correction after not changing since the 2015 update.
Considering the bare land component of the improved benchmarks and the bare land benchmarks, values changed in a range of -2.0-38.3%. Again, eliminating the land only Grant benchmark, the average change would have been 6.2% with two benchmarks exceeding 10% increases in value.
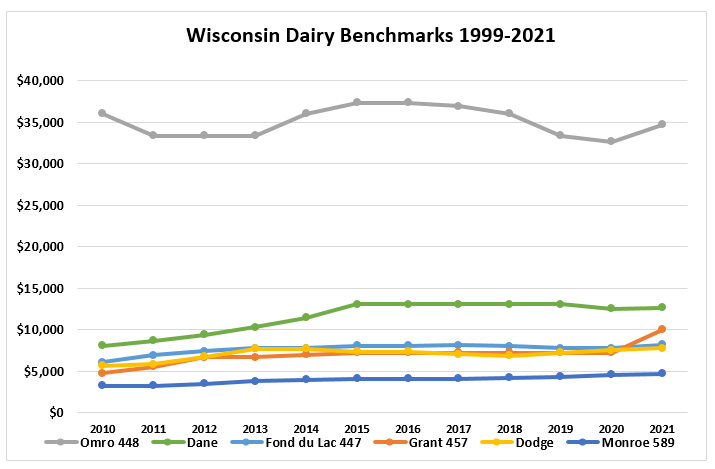 Image Caption
Summary
While supply chain issues in the food sector appear to have been corrected from the early days of the pandemic, there continues to be supply chain issues with the new machinery/equipment markets causing delays for new machinery delivery and a parts shortage for some items. The result has been lengthy delivery times for back orders, parts shortages and increased demand for used items. The pandemic of 2020 continues to have an impact in how land and machinery/equipment are marketed and sold. In 2020, there was a shift to online land and machinery/equipment auctions as the primary way to market each. Continuing into 2021 online/virtual and hybrid auctions continue to be the dominant sales methods.
Increases in commodity prices have fueled stronger land markets resulting in an increased supply of land being placed on the market. While demand still exceeds supply, more land has been coming on the market since last fall than the previous two seasons.
From 2013 through the 3rd quarter of 2020, land values were primarily sustained based on accumulated earnings and future expectations more than current anticipated earnings. Land markets were fueled by strong commodity prices leading up to 2013, and we are now seeing a similar trend.