Summer Land Value Recap
It’s hard to read any agricultural publication or social media without an article about skyrocketing land values, historical highs in land values, or the latest $20,000+/acre sale. As we track monthly value trends for our benchmarks, there are some observations:
- Land values do not move in a linear fashion
- All but three of Compeer’s 36 non-highly improved benchmarks are up double digits since July 1, 2021
- Cropland benchmarks had the strongest over all increases
- There are similarities between the current situation and the 2011-2013 period
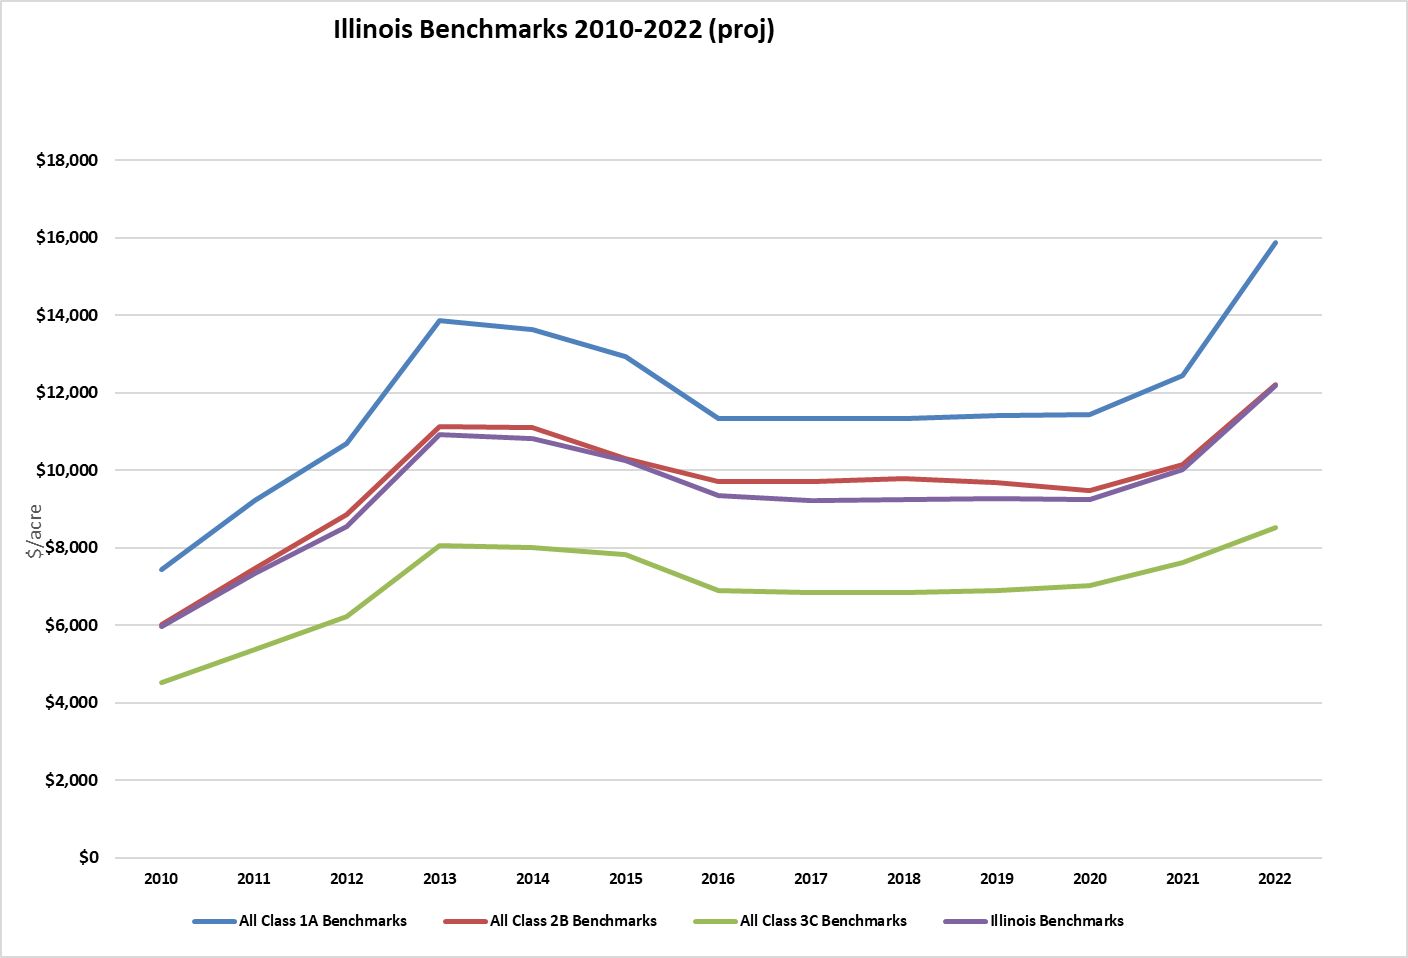
Illinois – Since July 1 Benchmark Update
- 18 benchmarks up an average of 22.3%
- Range of increases 8.7 - 44.2%
- Nine benchmarks increased 20% or greater
- Average non-weighted benchmark value - $12,222/acre
- 2011-2013 cumulative three-year change – +66.2%
- 2021-2022 projected two-year change - +37.1%
To add historical perspective, for the 2011, 2012 and 2013 benchmark updates, Illinois benchmarks were up 22.8%, 15.5% and 27.9% respectively. Over the next four years through 2017, these benchmarks were down a total of 14.8%, and remained mostly stable until the 2021 update where they were up 8.3%. Overall land value increases for the 2021-2022 period appear to be in line with those of the 2011-2012 period.
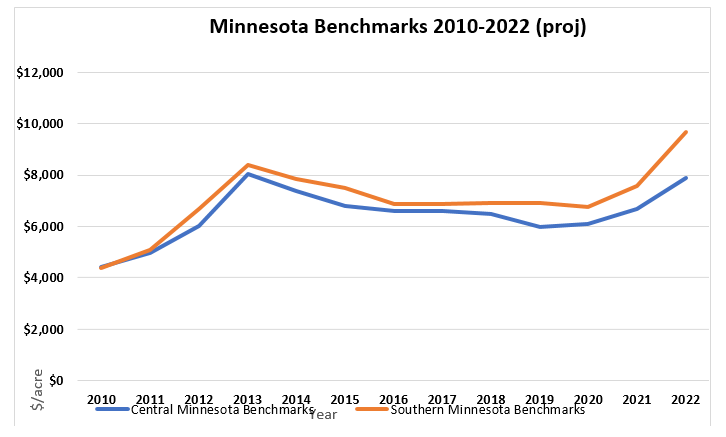
Minnesota– Since July 1 Benchmark Update
- 10 benchmarks up an average of 25.5%
- Range of increases 13.2 – 52.9%
- Four benchmarks increased 20% or greater (three exceeded 30%)
- Average non-weighted benchmark value - $9,325/acre
- 2011-2013 cumulative three-year change – +72.2%
- 2021-2022 projected two-year change - +37.4%
For Minnesota, there were similar trends with the 2011, 2012, 2013 benchmarks being up 15.5%, 28.8% and 27.9%. This was followed by a 19.6% decrease over the next four years, three years of stable to slightly down prior to an increase of 11.9% in 2021. Preliminary data suggests the 2021 through 2022 changes will be significant, but not as strong as those in the 2011-2012 period from a percentage perspective.
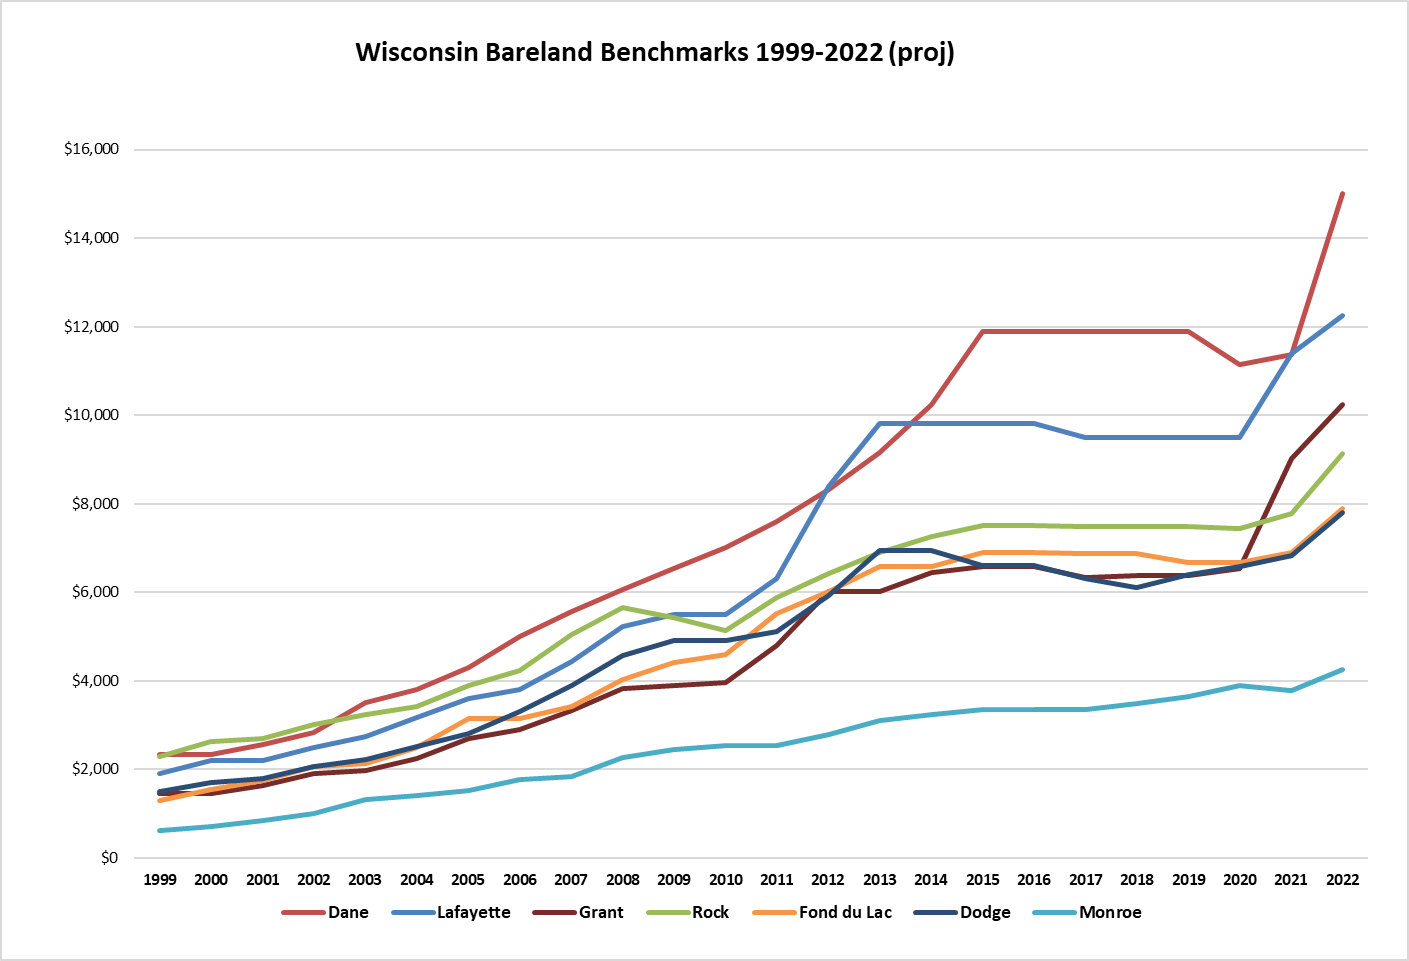
Wisconsin– Since July 1 Benchmark Update
- Eight bare land benchmarks up an average of 14.1%
- Range of increases 2.27 – 31.9%
- One benchmark increased 20% or greater and two increased less than 5%
- Average non-weighted benchmark value - $8,897/acre
- 2011-2013 cumulative three-year change – +43.4%
- 2021-2022 projected two-year change - +24.3%
Wisconsin bare land benchmarks for 2011, 2012 and 2013 were up 12.7%, 14.0% and 16.7%. Unlike the other two states, the following two years were up 4.4% and 3.2% followed by modest changes through 2021 prior to being up 10.2% in 2021. Wisconsin land values, with, a couple of exceptions, tend to follow dairy markets closer than crop markets and tend to be less volatile than crop farms.
Unless we see significant changes to the benchmark projections and land values for the 2023 benchmark update, I do not expect to see the percentage increases for 2021-2023 exceed those of the 2011-2013 period. While current values are higher on a per acre basis, the earlier period should a stronger increase on a percentage basis
Check out our other appraisal resources and find your local appraiser.