Can Your Equipment Strategy Withstand Tight Margins?
The last few years have placed grain farmers in a tough financial balancing act: inflation and escalating equipment costs on one side, and lower commodity prices and tighter margins on the other. Now more than ever, understanding the true cost of equipment ownership – beyond fuel and repairs – is critical to staying profitable. One powerful way to gain this insight? Benchmark your machinery and overhead expenses against peer farms.
|
Most farming operations have a solid understanding of their variable costs, but for many, understanding equipment and overhead costs is far more difficult to measure. Equipment expense is likely the largest cost and understanding the true cost of ownership can help you make informed decisions. There are a few resources farmers can turn to for benchmark comparison with respect to overhead and machinery costs.
University of Illinois farmdoc
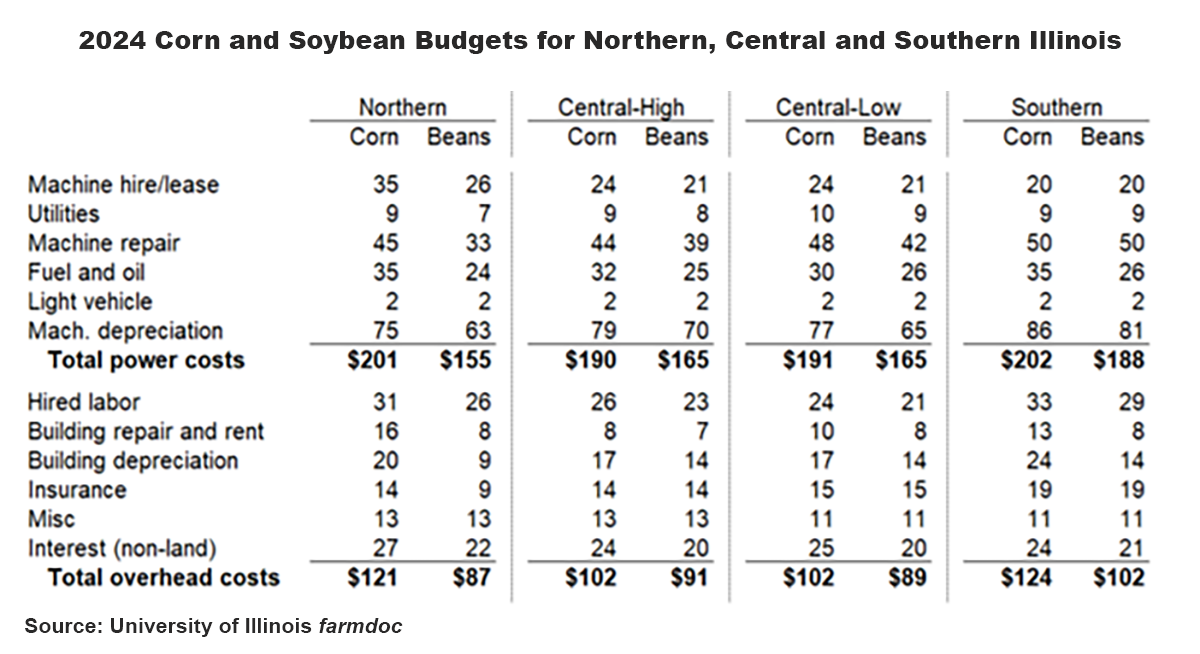
One trusted resource is the University of Illinois farmdoc, which compiles detailed cost-of-production data through the Illinois Farm Business Farm Management system. Reviewing these projections can help identify how your machinery and overhead costs stack up against others in the region.
The below table shows projected budgets based on farmer data in the Illinois Farm Business Farm Management system. As compared to the same data set in 2020, power costs are up approximately $65/acre for corn, and $20/acre for soybeans. Overhead costs increased about $25/acre for corn and $15/acre for soybeans in the same period. This supports the feeling many clients have surfaced as their production costs continue to rise. Maintaining a competitive cost structure is key for grain farm profitability – and with the cost of today’s equipment and repairs – this is more challenging than ever to manage.
University of Minnesota FINBIN
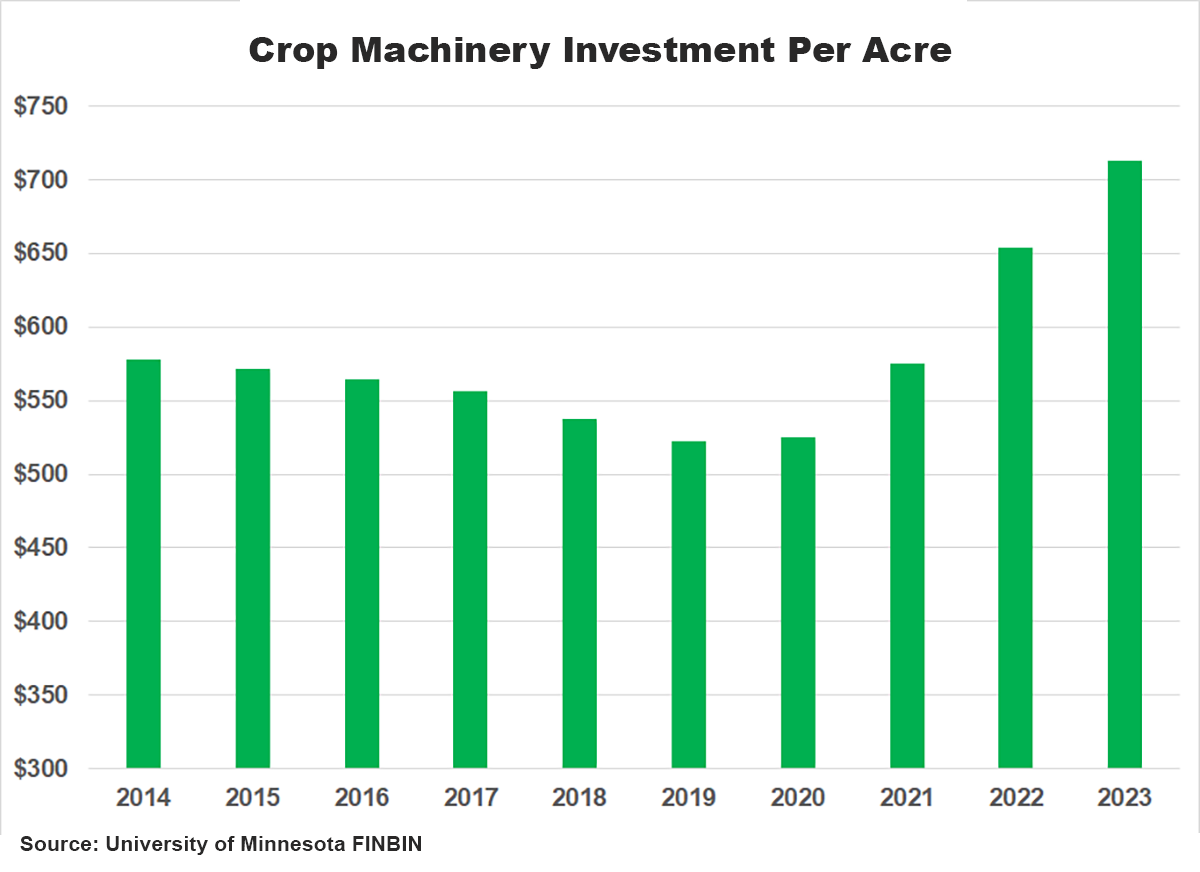
Another way to measure equipment is on an investment cost per acre basis. With increasing equipment costs, this has been steadily increasing since 2020. Below is some data from the University of Minnesota FINBIN.
For operations with limited acres, this rising investment cost per acre can quickly erode margins. Tracking this metric over time can help determine whether to delay upgrades, lease equipment or explore cooperative ownership strategies.
Financial Peer Reports from Compeer Financial
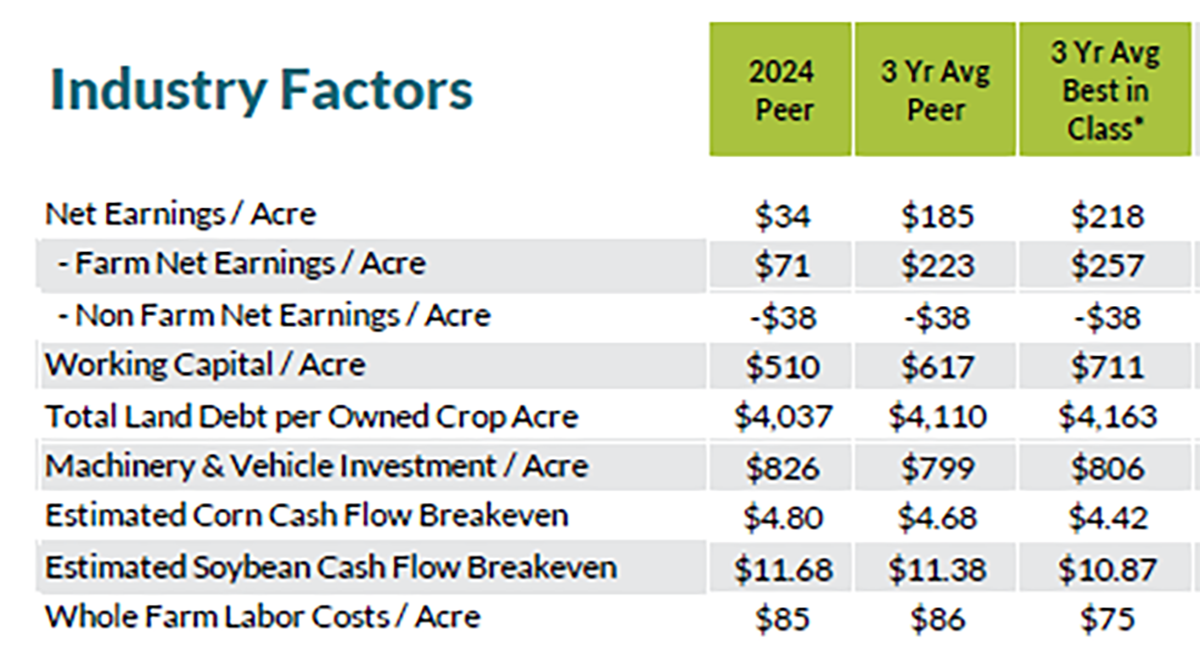
Here at Compeer, we maintain industry benchmark information about certain industries we finance in our Financial Peer Reports. One area we track is machinery investment per acre – similar to the above table. The farms in our benchmark are showing a machinery investment/acre of $826 for 2024, as revealed in the table below.
By comparing farmdoc averages, FINBIN investment trends and Compeer’s peer data, farmers can build a clearer picture of whether their machinery costs align with similarly sized or structured operations. For example, if your cost per acre significantly exceeds peer averages, it may be time to reassess the mix of owned versus leased equipment or upgrade planning timelines.
Benchmarking equipment costs isn't always easy – but it’s essential. As prices rise and margins tighten, producers who understand their machinery cost structure will be better positioned to stay competitive, invest wisely and protect long-term profitability.
Benchmarking Basics
Benchmarking is a powerful tool farmers can use to better understand and improve their operation. Compeer can help you see how you stack up against other producers and guide you to meet your goals.
Grain Margin Manager
Self-Paced eLearning
Access self-paced courses covering a wide range of farm financials.


