Farm Benchmark Data Reveals Resilience Through Lower Margins
Comparing yourself to other farms can be hard when every operation is so different. Compeer can help with its annual data for farm benchmarks. We annually put together data to provide real-time financial benchmarks and feedback to clients. Analyzing your strengths and weaknesses on an annual basis in comparison to your peers can help guide future decision making for your operation.
|
Let’s dive into the results revealed in the 2023 grain farm financial ratios and benchmarks.
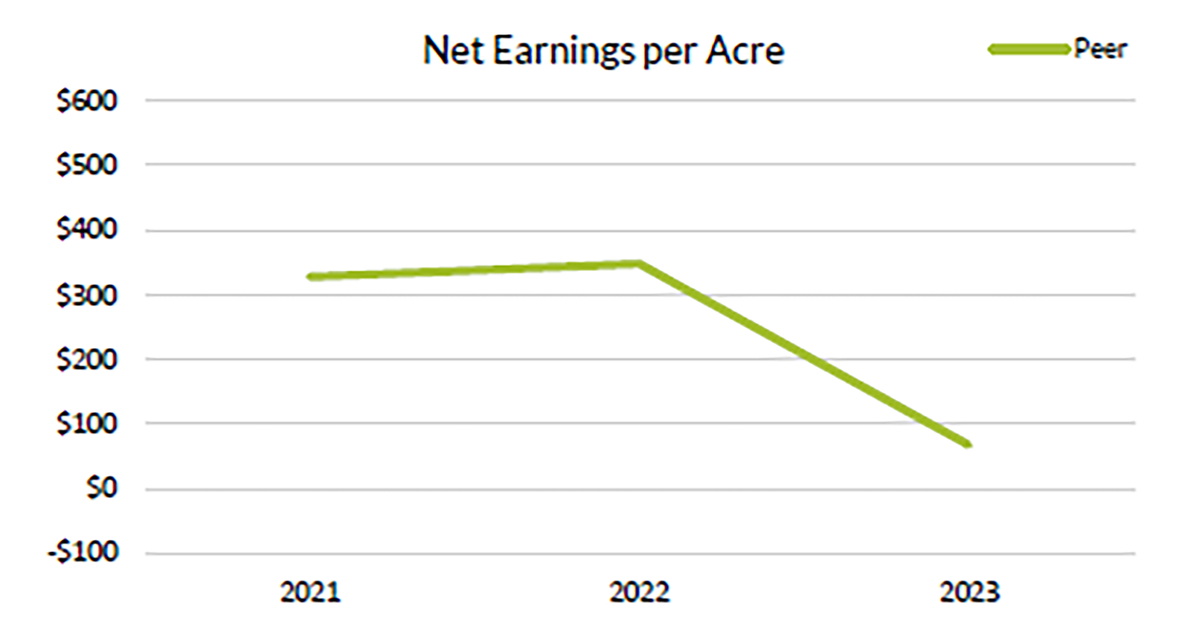
2023 profit levels looked a lot different for grain farmers in the upper Midwest compared to the previous few years. Higher input, interest and rent costs, coupled with lower grain prices, narrowed margins for many producers. As a result, average net earnings per acre decreased from $328.00 and $353.00/acre in 2021 and 2022, respectively, to $67.00/acre as shown below.
Crop Revenue Down Along with Grain Prices
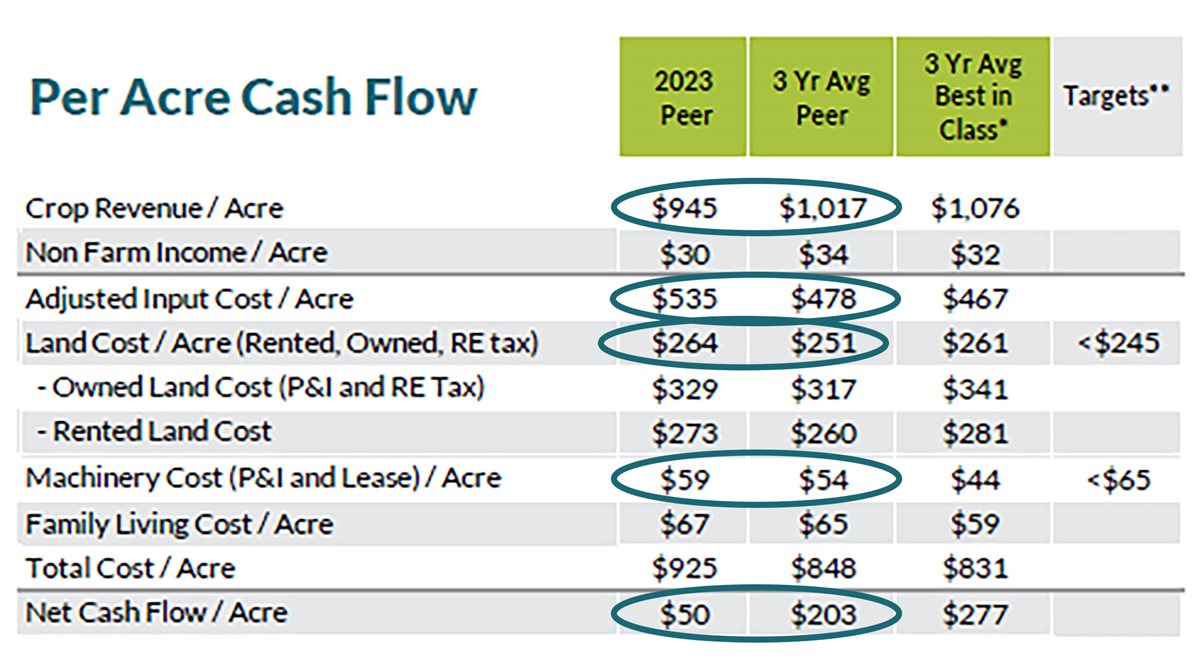
With a more than $3.00/bushel reduction in the corn price from January to December 2023, and a more than $2.50/bushel reduction in the soybean price in the same time, it comes as no surprise that 2023 crop revenue was down. Crop revenue averaged $945.00/acre in 2023, as compared the three-year average of $1,017.00/acre.
Input & Land Costs Drive Earnings Lower
Not only were crop prices lower, but producers paid higher input and rent prices to get their 2023 crops in the ground. 2023 average adjusted input cost per acre was $535.00 compared to $478.00/acre compared to the three-year average. Land costs were up $13.00/acre and machinery costs were up $5.00/acre in comparison.
As a result, net cash flow per acre decreased to $50.00/acre compared to the three-year average of $203.00/acre. Net cash flow acre is based on cash earnings on a non-accrual basis for the year (i.e., how a producer’s cash flow was affected).
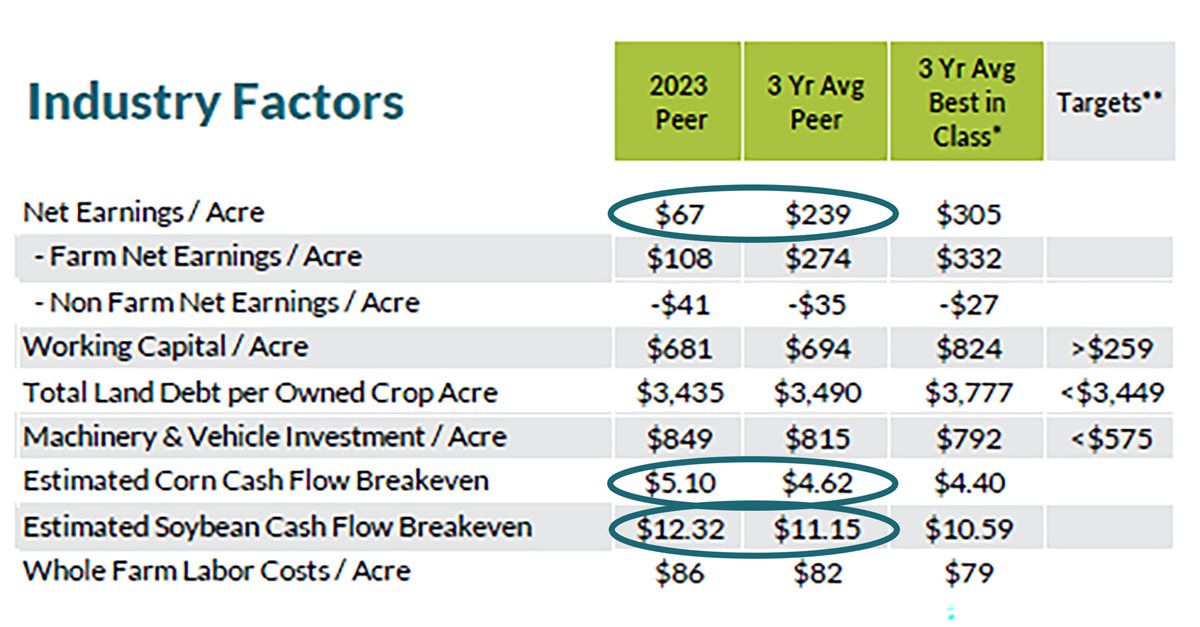
Higher input and land costs pushed average corn and soybean cash flow breakeven numbers up in 2023. Corn cashflow breakeven averages increased $0.48/bushel in 2023 to $5.10/bushel as compared to the three-year average of $4.62/bushel. Soybean cashflow average was up to $12.32/bushel as compared to $11.15/bushel for the three-year average.
Net earnings per acre (accrual adjustments included) decreased from $172.00/acre to $67.00/acre this year, as compared to the three-year average of $239.00/acre.
Operating & Interest Expenses
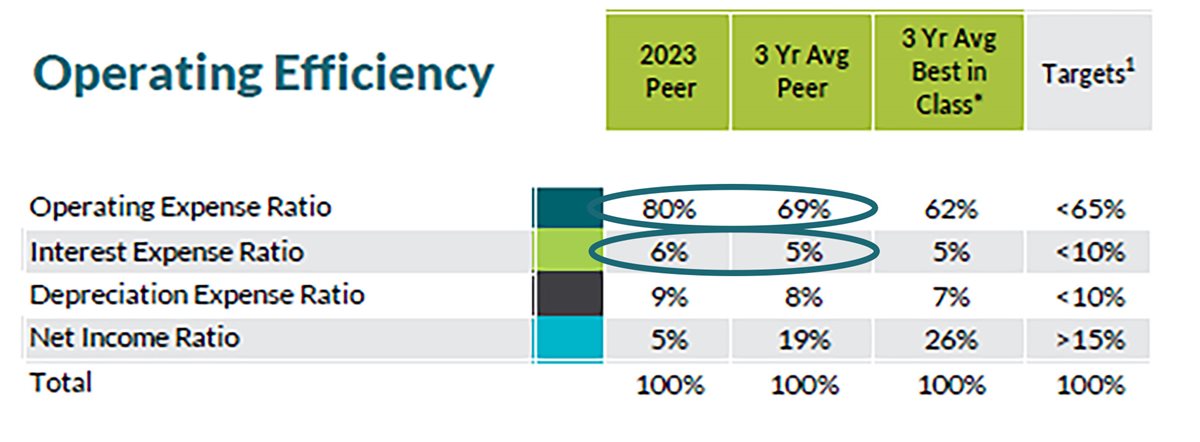
Operating expense ratios (OER) increased as a result of higher expenses and lower gross income. Average OER was 60% in 2022 and increased to 80% in 2023, contributing to a three-year average of 69%. Interest expense ratio was also up 1% of total revenue as compared to the three-year average.
.png)
With revenues down in 2023, it is no surprise that debt service per value of farm production (VFP) increased from 10% to 14% in 2023. VFP is calculated by dividing the current principal and interest payments by the value of farm production. A larger portion of an operation’s revenue had to be used for term debt payments in 2023.
Managing through Lower Margins
While revenue was down and expenses were up, farm financial ratios and benchmarks show producer’s balance sheets remained relatively stable. Producer’s working capital decreased on a per acre basis from $767.00/acre in 2022, to $681.00/acre in 2023. Working capital divided by adjusted gross income increased from 54% in 2022, to 57% in 2023 due to decreased revenues. Owner equity ratio remained stable going from 68.62% in 2022 to 68.53% in 2023.
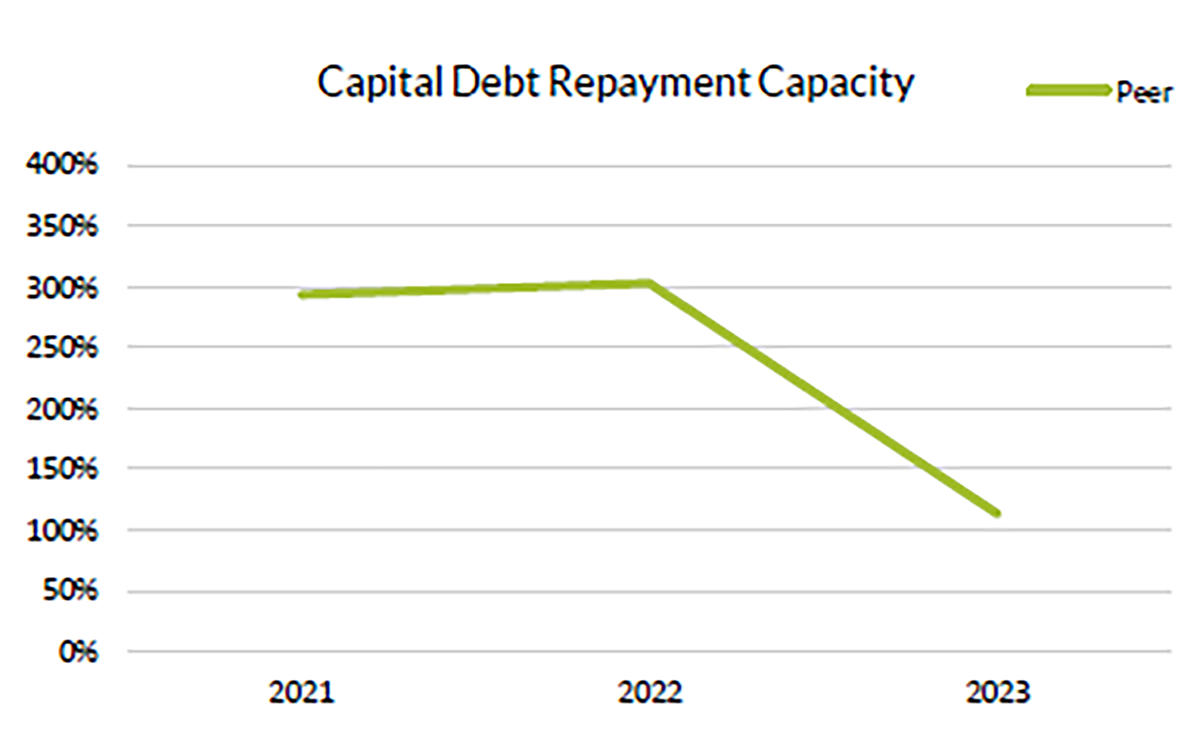
Capital debt repayment capacity (CDRC) significantly decreased from more than 275% in 2021 and 2022 to 113% in 2023. CDRC is a measure of an operation’s ability to make term debt payments (we recommend targeting more than 115%). Even with decreased revenue and increased expenses, producers were able to make their term debt payments with a small margin remaining for capital purchases or to add to working capital.
While margins were tighter in 2023, overall the successes of 2020, 2022 and 2023 put most farmers into an excellent working capital position. That helped farmers navigate this lower-margin year.
To learn more about how to financially benchmark your operation and see how your farm stacked up to three-year averages and peers, reach out to your local Compeer financial officer.
