Farm Benchmarking Insights: Profitability Beyond 2025

In 2025, U.S. farm profitability is expected to rise – but most of that growth is projected to come from government support programs, not stronger market performance. With crop returns trending lower and input costs still elevated, it’s more important than ever for farmers to understand what’s truly driving their bottom line.
That’s where financial benchmarking comes in. At Compeer Financial, our Financial Peer Report provides farmers with a personalized comparison of their operation’s performance relative to similar peers. It also highlights a “Best in Class” category – the top 25 % of farms by net earnings per acre – helping clients see how top performers manage efficiency, scale and risk.
|
How Benchmarking Reveals the Profitability Gap
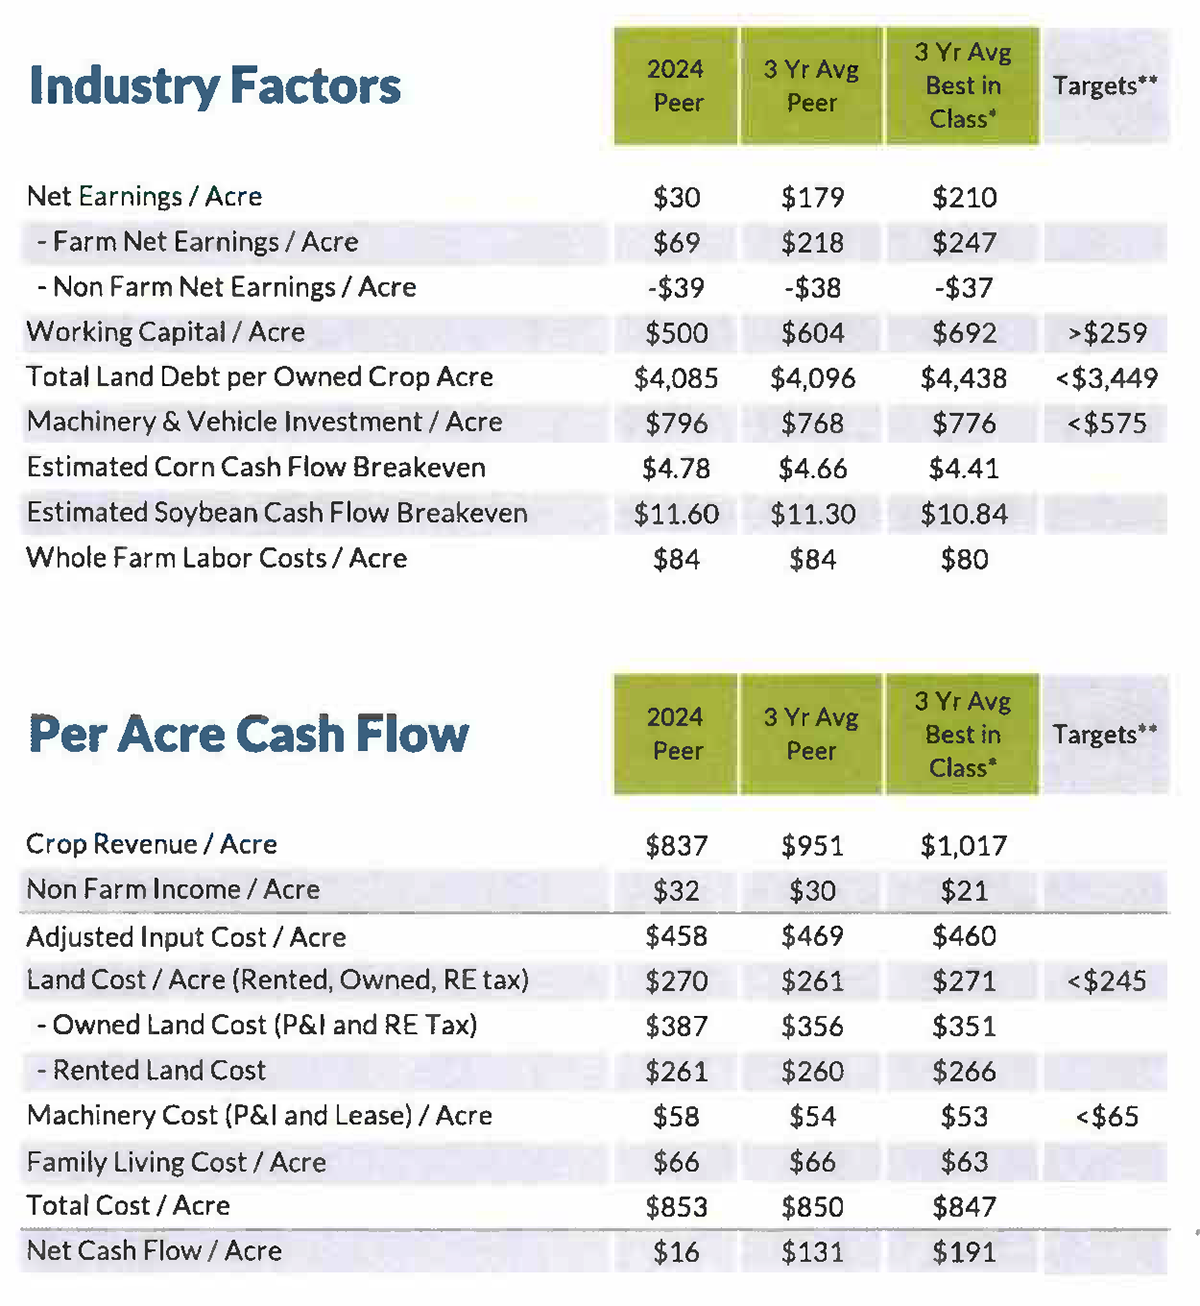
Over a three-year average (2022–2024), Compeer data shows that the “Best in Class” group earned $210 per acre, compared with $179 per acre for the broader peer group for a $31 advantage. Below compares various categories between the “Best in Class” and peer groups.
- Crop revenue: $1,017 vs. $951 per acre ($66 difference)
- Corn yield: 223 vs. 215 bushels per acre
- Soybean yield: 65 vs. 62 bushels per acre
- Total costs: $847 vs. $850 per acre
One might assume higher yields would require higher production costs, but the data shows these stronger results come from operational precision. In fact, “Best in Class” producers tend to manage slightly lower total costs, even while paying marginally more for land rent ($266 vs. $260 per acre). The “Best in Class” compensate for higher rent with lower input costs per acre (all expenses except land, equipment and family living expenses), as well as lower machinery and family living costs.
Their efficiency shows up in the cost of production:
- Corn – $4.41 per bushel (vs. $4.66)
- Soybeans – $10.84 per bushel (vs. $11.30)
That edge compounds over time, especially when prices weaken or payments fluctuate.
Understanding Today’s Profitability Drivers
According to the USDA Farm Income Forecast from Sept. 3, net farm income is expected to increase to $179.8 billion in 2025. However, direct government payments are forecast at $40.5 billion – the highest since 2020. That surge reflects disaster assistance and supplemental aid programs designed to offset falling commodity prices and weather-related losses.
In other words, much of the sector’s apparent profitability is policy-driven, not price-driven. Corn and soybean cash receipts are projected to decline, and many farmers face tighter margins once subsidies are excluded.
What Benchmarking Can Tell You
Because subsidies can distort the picture, benchmarking helps separate short-term relief from long-term strength:
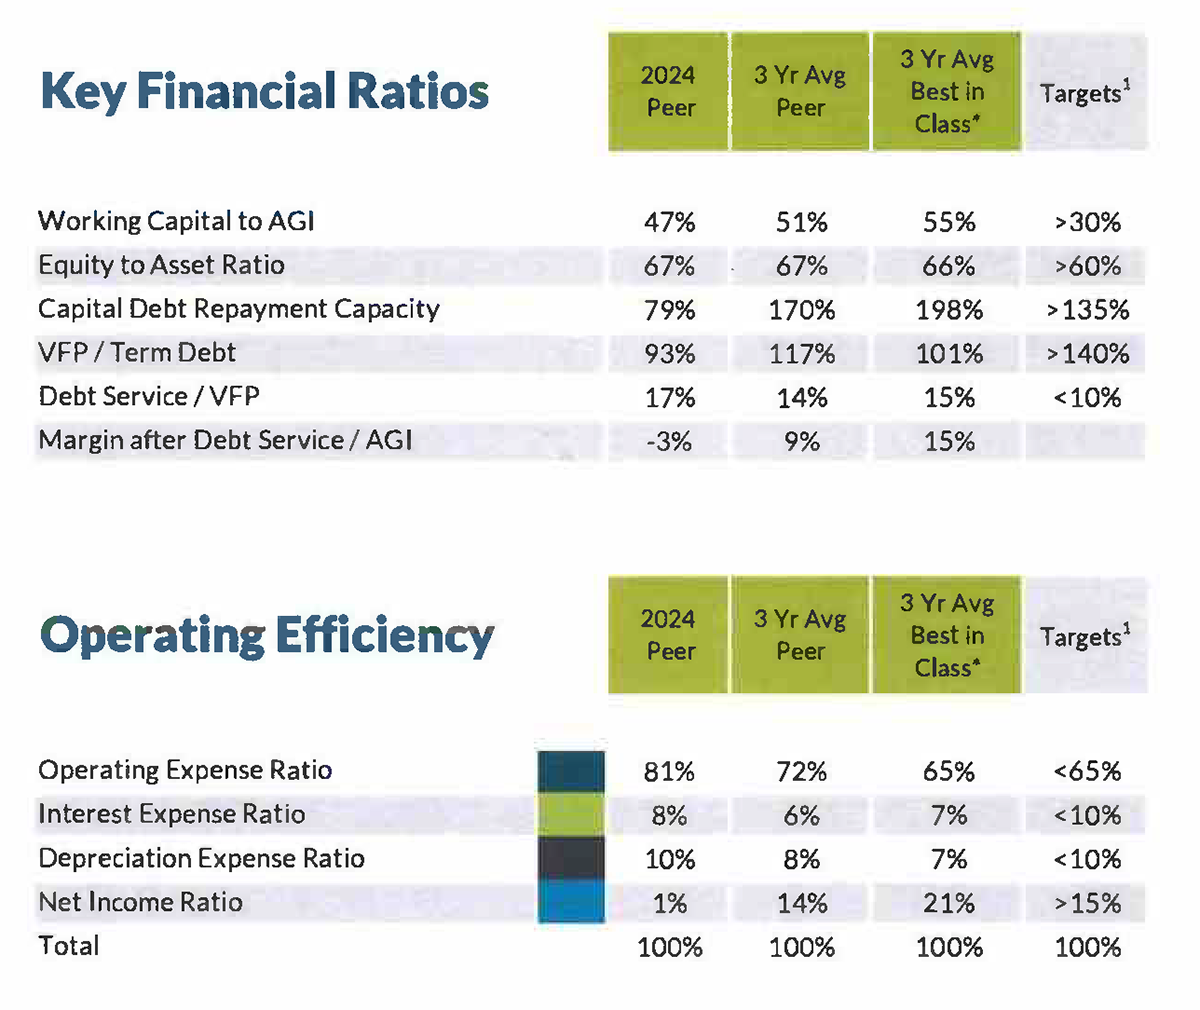
- Working capital per acre: “Best in Class” farms average $692 – $88 above the peer group.
- Operating expense ratio: 65% – 7 points lower than the peer average.
- Net income ratio: 21% – 7 points higher.
These metrics highlight disciplined cash management and operational resilience, both traits that matter far more than temporary payments.
Applying Insights to Your Operation
To make the most of benchmarking data:
- Dissect the source of your profitability: Identify whether improvements stem from operational gains or from external support.
- Sharpen cost control: Use cost-per-acre and cost-of-production data to find input, machinery or family-living efficiencies.
- Protect working capital: Strengthen liquidity to manage debt service and volatility when government aid levels change.
- Plan beyond 2025: Build strategies that hold up when subsidy programs normalize focusing on yield quality, risk management and scale efficiency.
The Bottom Line
Government payments may temporarily lift income, but true financial strength comes from managing what’s within your control – efficiency, yields, and cash flow.
Benchmarking through Compeer Financial’s Financial Peer Report helps farmers pinpoint those controllable factors and measure their progress toward sustainable profitability, regardless of where commodity prices or policy programs go next.
Look at financial benchmarks for your operation and find areas to consider focusing on going into 2026 today with your local Compeer financial officer.
Harness the Power of Benchmarking for Your F…
Benchmarking provides a clear view of where to focus efforts. Assessing these key targets can help structure your farm operation’s balance sheet for success.


