Fed Waits While Ag Markets Monitor Weather & Trade

- 11 minute read or Click here and save for later -
As inflation and unemployment rates remain remarkably stable, the next Federal Open Market Committee (FOMC) of the Federal Reserve meeting at the end of July is unlikely to result in major changes to monetary policy – although anything is possible. For now, it’s still a “wait and see” holding pattern when it comes to tariff impacts for the broader macroeconomy and the agricultural economy.
|
Remarkably Stable Inflation, Unemployment and Fed Policy
Let’s start with a look back at last month’s FOMC meeting held June 17-18. That meeting resulted in both economic projections, which are released at only every other meeting four times per year, and a monetary policy (FOMC) statement, which is done at every meeting eight times per year. Economists and market analysts closely watch the quarterly economic projections summary to gauge where the Committee may head in the future with monetary policy. In particular, the dot plot is heavily scrutinized because it maps where Committee members think the federal funds target rate will go in the future. Each Committee member’s projection is represented on a graph by an anonymous dot, hence the dot plot name.

Between March and the June meeting, the average expected federal funds target rate on the dot plot stayed the same – the FOMC projects an average of two cuts (the equivalent of a half percent drop) by the end of 2025. But the distribution of the dots changed from March to June. More members now expect no cuts: seven committee members projected keeping the target rate the same for the entirety of 2025. Two project just one cut, the majority (eight members) project two cuts and two project three cuts. In the economic forecast, committee members also projected slightly higher expectations for inflation and unemployment as compared to March. They also lowered expectations for gross domestic product (GDP) growth. This all adds up to a picture that shows slight stagflation. Although take all the projections with a grain of salt; many members reported uncertainty in their projections.
In terms of the FOMC monetary policy actions in June, the results were uneventful. As very widely expected, the Federal Funds target remained 4.25-4.5% at the June meeting, and there were no other changes of note. Next up is the July meeting, where there is a slightly higher chance the Fed could lower rates. But the chance is slim. Looking at the new inflation and unemployment data released since the June meeting helps explain why.
June’s Personal Income and Personal Consumption Expenditure (PCE) inflation data covers May’s spending and showed a slight 0.1% month-over-month uptick in inflation. But the information from May is not as important to the Fed as the report next month, which will include June information. That release will finally have summer-time price information, which is what the Fed has been waiting for in terms of tariff-related delayed inflation impacts.

In May’s PCE, inflation trended up while income trended down. The PCE overall price index increased 2.3% year-over-year. Excluding food and energy, the PCE price index increased 2.7% year-over-year. Both measures are over the Fed’s 2% target. At the same time, we also received the third estimate of GDP. GDP is so complex of a measure that it is continually updated until the final posting – four months after the first data release. The GDP third estimate showed yet another revision down to –0.5 growth in Q1 2025. The primary negative growth factor in the first estimate was a surge in imports, but subsequent estimates like this third one have been revised due to the data showing lower consumer spending than previously reported.
The last key piece of data comes from June’s Employment Situation Report, released in early July. This showed June nonfarm unemployment at a solid 4.1% (a tenth improvement over the past three months of 4.2%) and job growth of 147,000 driven by strongest jobs growth in the state and local government sectors. Both the unemployment rate of 4.1% and the positive monthly jobs growth at 147,000 show a remarkably stable and resilient jobs market. The Bureau of Labor Statistic’s Employment Situation Report came one day after the ADP Employment Report showed a private jobs growth contraction of –33,000 in June (considerably lower than some pre-report estimates). It is not entirely unusual for these two reports to show different trends, as they measure different populations and use different methodologies. But this discrepancy is something to keep an eye on as it could single signs of weakness in the private sector that are not yet showing up in the official Bureau of Labor Statistics report.
Both the inflation numbers and unemployment numbers are little changed from prior months, and both went a hair in the opposite direction of what is more likely to cause a rate cut (i.e., inflation went slightly up when the Fed is looking for it to fall, and unemployment went slightly down when the Fed is looking for it to stay the same or increase). Therefore, the thought is that the July meeting of the Fed will see yet another rate pause. Anything is possible though, so never say never.
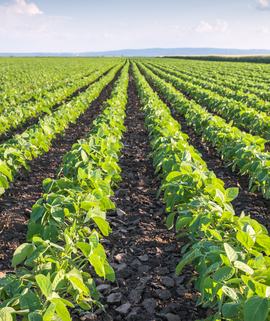
More of the Same for Corn and Beans
Arguably the biggest summertime report for corn and soybeans is the annual end of June USDA Acreage Report. USDA estimated 95.2 million acres of corn planted in the U.S. for 2025, up 5% from last year and 83.4 million acres of soybeans planted, down 4% from last year. As a refresher, the end of March USDA Planting Intentions Report estimated 95.3 million acres for corn and soybeans estimated at 83.5 million acres. In spring, the question was whether the weather would allow farmers’ big intentions for corn to match actual planting behavior. Overall, it seems the weather enabled most corn and soybean acres to go in as farmers intended based on the June numbers. If weather continues to be conducive to good crop growth, we will be on track for a large corn crop. Much of the report fell right within pre-release estimates, and for corn and soybeans it was considered to be a fairly unsurprising report with little market reaction.
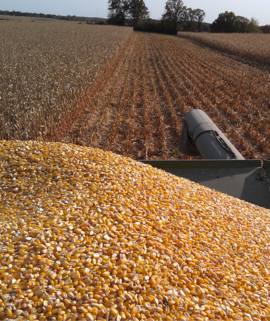
The July World Agricultural Supply and Demand Estimates (WASDE) also held little to shock the market. The July 2025/26 U.S. corn outlook showed smaller supplies, domestic use and ending stocks. However, with yield projected at 181 bushels per acre and so many corn acres getting planted, production is still projected higher than 2024/25. The combo of smaller stocks but higher production evened itself out a bit, resulting in the forecast season-average farm price received by producers remaining unchanged at $4.20 per bushel. The July 2025/26 U.S. soybean outlook showed slightly lower production, higher crush, reduced exports and increased ending stocks compared to last month. This caused the soybean forecast price to drop to $10.10 per bushel, down 15 cents from last month. Let’s talk a little more about the higher crush forecast. The WASDE adjusted crush in relation to the recently released Renewable Volume Obligations (RVO) from the Environmental Protection Agency (EPA). Biodiesel’s proposed RVO came in at 5.61 billion gallons, which is significantly higher than prior years. This pushed soybean oil demand forecasts for biodiesel higher.
Without surprises from USDA reports to drive domestic trade, we are in a “weather-driven-market" for now. Crop conditions are primarily rated good/excellent. In general, nice weather is keeping crop prices low/bearish, and bad, very widespread adverse weather would be needed to turn things back higher/bullish. There are certainly heartbreaking pockets of extreme and devasting weather impacts nationwide over the past month, but they are currently relatively isolated.
That said, the new August 1, trade deadline is approaching and prior major tariff news dates all caused a few days to weeks of a “tariff-news-driven-markets" as things worked out. Here’s what we know for certain. There is an official written extension of the pause on reciprocal tariff rates until August 1, that had been set to go into effect July 9, after a 90 day pause from the prior implementation date of April 9. The rest becomes more unofficial, as announcements of possible new rates and copies of letters addressed to various countries with new reciprocal rates have been posted but are not yet official in executive orders.
Any walk-back of previously agreed upon carve-outs for agricultural-related imports and exports, such as the current exemption for goods covered in the United States Mexico Canada Agreement (USMCA), will likely result in near-term deterioration of agricultural commodity marketing prices. Even without much official policy besides the August 1 delay, prices are drifting lower on the combo of good weather and tariff rumors.
An OBBBA Corn and Soybean Call Out
The One Big Beautiful Bill Act (OBBBA also known as the Megabill), was signed into law July 4, and has many provisions with impact to agriculture and food. There are many in-depth summaries (including at Congress.gov). The law contained approximately $66 billion increase in baseline for farm programs included in the OBBBA. This traditionally would be authorized in a Farm Bill, including $53 billion for commodities programs (ARC/PLC etc.), $3 billion for disaster assistance programs, $6 billion in increased crop insurance subsidies and $4 billion for “Additional Investments in Rural America.” Why include some but not all the Farm Bill? This was due to OBBBA needing to follow the strict Byrd rule, which meant no policy items could be included, only items with a budgetary impact. Therefore, the process to renew the 2018 Farm Bill is only half complete, with all the Farm Credit System's individual priorities yet to be enacted. House Ag Chairman G.T. Thompson estimates $8 billion remains for the Farm Bill 2.0 (aka the “skinny” bill).
In terms of the corn and soybean programs, USDA sets the final numbers, so consider anything you read on OBBBA farm payments an unofficial projection until it’s published in black ink by Farm Service Agency (FSA). In brief, Section 10301 of the OBBBA increased corn and soybean statutory reference prices to $4.10 for corn and $10.00 for soybeans (with inflation adjustment post crop year 2031). Consider that the new hard price floor. But there’s a multiplier in the form of effective reference price – the variable price floor. The effective reference price had advantageous formula changes in OBBBA too, going to 88% of the 5-year price Olympic average from 85%, but with a 113% cap instead of 115%. For 2025, corn will be at an effective reference price of $4.42 and beans will be at an effective reference price of $10.71. The higher of the ARC or PLC payment will be paid for 2025 with a payment date of October 2026 regardless of a farmer’s selection during 2025 sign-up. Here are the old pre-OBBBA FSA reference price calcs for comparison.
Will the weather hold? Will all the trade deals get worked out? The rest of summer will be an impactful one for grain and oilseed markets. Weather is one of the most unpredictable variables in agriculture – and one of the most impactful. With shifting climate patterns, extreme weather events and tighter planning windows, building resilience is no longer optional. Join Compeer Financial’s AgriMindset webinar on July 23 at 1:00 p.m. for expert insight into navigating weather-related risks. Eric Snodgrass, senior science fellow and atmospheric scientist at Nutrien Ag Solutions, will share weather outlooks, strategies and planning tools to help you adapt.
The information provided is accurate to the best of the author’s knowledge at time of publishing. It is presented “as is” with no guarantee of completeness, accuracy or timeliness, and without warranty. The information is educational in nature and not investment, legal, accounting, tax or other advice of any kind.
Economic Minute
Get expert insights on commodity prices, interest rates and agriculture economic trends with practical, no-nonsense analysis to make smarter financial decisions on your farm.