Oil Price Volatility Raises 2026 Planting Risk

- 5 minute read or Click here and save for later -
After a fairly quiet month economically, the last day of February brought an unexpected market shock. Global geopolitical conflict resulted in oil prices surging in early March—a record-breaking one-week increase in crude oil prices. Oil prices are correlated with a number of key economic indicators, both for agriculture and the general economy. These include everything from, most directly, the fuel used to power our equipment to fertilizer inputs during spring planting to, indirectly, oilseed and grain prices and finally overall inflation. From a lending perspective, consumer inflation and prices are major drivers of the likelihood of future rate cuts. To put it mildly, a lot has happened in the economy recently. Let’s break it down.
Due to the significant escalation of geopolitical conflict in Iran, shipping in the Strait of Hormuz had halted at the time of writing this article. An incredibly tight ocean passage bordered by Iran to the north and a small governate of Oman to the south, the Strait connects the landlocked Persian Gulf to the Gulf of Oman and the rest of the world. Since the waters narrow to just 24 miles at one point, with Iran claiming 12 miles and Oman claiming 12 miles, there are effectively no international waters for ships to pass through at the pinch point. As an essential shipping route for Middle Eastern trade, the Strait ships roughly 20-30% of global oil and liquified natural gas and serves as a major artery for global nitrogen and phosphorus fertilizer exports. These critical commodities are essential supplies to agriculture, and any disruption to their international trade causes economic concern, particularly if it comes at a time of high demand, like ahead of spring planting.
Iran has previously supplied about 10% of the U.S.’s urea, although that number has recently trended down. Qatar supplies both urea and liquid ammonia to the market, making up about 10% of the U.S.’s total imported nitrogen as of February 2026. In terms of phosphorus fertilizers, which were already facing high prices prior to March 2026, Saudi Arabia is the source of one-third of U.S. imports. All of these countries, not to mention the United Arab Emirates and Oman, ship via the Strait of Hormuz.
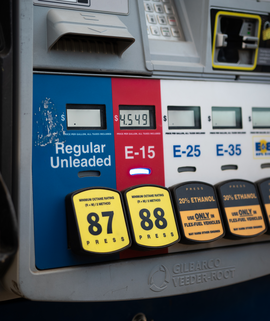
What does this mean to spring fertilizer and other energy-related input prices if not already pre-priced? Prices are rising quickly, and availability is a concern. But just as prices can rise quickly, they can fall. For example, crude oil experienced a roughly 40% price increase in a single week—the fastest on record— before seeing a sharp one-day decline in price. This volatility and unexpected market shock are an excellent reminder to think proactively about risk management, not just when selling production, but when purchasing inputs.
For corn and soybeans, the planting waiting game begins
If equity and futures markets in early March can be summarized as “big changes," then the March World Agricultural Supply and Demand Estimates (WASDE) report could be summed up as the opposite: not much going on. In March, the 2025/26 U.S. corn supply and demand estimates saw no changes relative to the February WASDE. The projected season-average corn price was also unchanged at $4.10 per bushel. From a global perspective, overall corn supply was raised as greater global production was incorporated into worldwide estimates, for example Brazil’s large first crop of corn. For U.S. soybeans, there were limited changes and the projected 2025/26 season-average soybean price remained at $10.20 per bushel. Globally, dry conditions in Argentina lowered soybean production estimates marginally, resulting in a slight decrease in overall global supply.
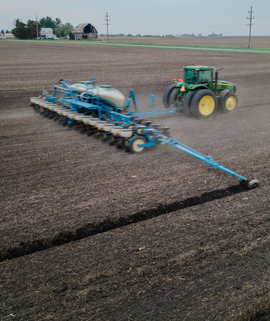
With planting of the 2026/27 U.S. crop quickly approaching, and a confusing array of agricultural economic factors at play, the question becomes: how much corn and soybeans will be planted in the coming months? The annual late-winter United States Department of Agriculture (USDA) Agricultural Outlook Forum provided the first official USDA estimates of 2026/27 production by commodity, giving greater detail to USDA’s initial 2026 farm income estimates. USDA estimated corn acres for the 2026 season down nearly five million acres at 94 million, with yield at 183 bushels per acre—both down significantly from 2025’s record highs. USDA estimated soybean acres up almost four million acres to 85 million, with yield flat at 53 bushels per acre.
But these acre estimates came before the fertilizer and input volatility of the last few weeks. Taking into account potentially higher fertilizer prices, which affect corn more than soybeans, there could be an additional shift from corn to soybeans on marginal acres. Furthermore, the 2.4 soybean-to-corn price ratio during February’s crop insurance price discovery period would suggest increased soybean acres. Could the 85 million acres of estimated soybean acres go even higher? The equations are changing daily with the news, and predicting where things will land is difficult in a rapidly changing price environment. Throw in weather, biofuel and trade unknowns, and the outlook is hazy.
No changes in monetary policy expected at March meeting
The next meeting of the Federal Open Market Committee (FOMC) is March 17-18. Looking ahead to the signals driving the decisions at the March meeting, January and February labor data show mixed signals. As a refresher, January monthly jobs growth showed a positive increase of 130,000 additional jobs and the national nonfarm unemployment rate improved to 4.3%. This was seen as a possible turning point for the shaky labor market that contributed to last fall’s three fed rate cuts. But February’s employment situation report showed a labor market continuing to soften. Nationally, there was a contraction of –92,000 jobs month over month, and the nonfarm unemployment rate increased slightly to 4.4% in February.
For inflation, the Personal Consumptions Expenditures (PCE) price index, the Fed’s preferred inflation measure, came in at 2.9% inflation from a year ago, and core PCE (excluding volatile food and energy) was 3.0%. On a monthly basis, both rose 0.4%. This was seen as stable, but higher than desired inflation. For GDP, the advanced estimate for Q4 2025 was 1.4%, weaker than anticipated and down from the prior quarter’s 4.4%. This percentage may change during the revisions process. We’ll get another look at PCE inflation and GDP on March 13 right before the Fed meets.
Market likelihood of a rate cut (-0.25%) in March is negligible with market estimates currently at less than a 1% chance. Two fed funds cuts later in 2026 are still favored, but the odds are getting slimmer. Energy prices are a major driver of inflation. So, if the oil price situation turns out not to be transitory, then instead of rate cuts, stagflation (where unemployment increases at the same time inflation goes up and GDP stagnates) could lead to no cuts or increased rates. The next month may prove pivotal in determining which way the scales will tip.
Reframing grain marketing: From price reaction to risk strategy
From tariffs to oil, from record-breaking production to weather, the last year has resulted in chaotic prices, making grain marketing risk management more important than ever. Join Compeer Financial for an AgriMindset webinar March 18 at 1:00 p.m., focused on foundational principles of grain marketing and risk management with Jeff Kazin and Mike Rohlfsen of Agris Academy. You’ll learn how to better understand your overall risk position and use market structure as a guide for more confident, repeatable decisions. If you can’t join live, you can watch or listen to a recording at any time or listen to the AgEdge podcast version the following day wherever you get your podcasts.
The information provided is accurate to the best of the author’s knowledge at time of publishing. It is presented “as is” with no guarantee of completeness, accuracy or timeliness, and without warranty. The information is educational in nature and not investment, legal, accounting, tax or other advice of any kind.